COVID-19 Energy Map
Global Mapping of Emergency Measures Adopted During the COVID-19 Pandemic for Continuous and Affordable Household Energy Supplies
About the COVID energy map.
Since March 2020, researchers from the EU COST Action ENGAGER Energy Poverty have mapped out 380+ global responses to the COVID-19 pandemic, as undertaken by governments, regulators, utilities and energy companies to ensure continuous and affordable energy supplies for households during the COVID-19 crisis. This global mapping excercise resulted in the most comprehensive international evidence-based database of emergency measures undertaken , to date, to support access to energy services and alleviate energy poverty. The map can be used by researchers and policy-makers alike to study and compare responses to COVID-19. The map covers measures in all regions until March 2021, and specific updates for Asia and Europe (until March 2022), and Latin-America (until September 2022).
More info can be found below.
Methods for the COVID-19 map and data analysis:
Publication.
Hesselman, Varo, Guyet & Thomson, 'Energy Poverty in the COVID-19 Era' (2021)
Energy Research and Social Sciences,
https://doi.org/10.1016/j.erss.2021.102246.
Browse the new panel dataset and dashboard.
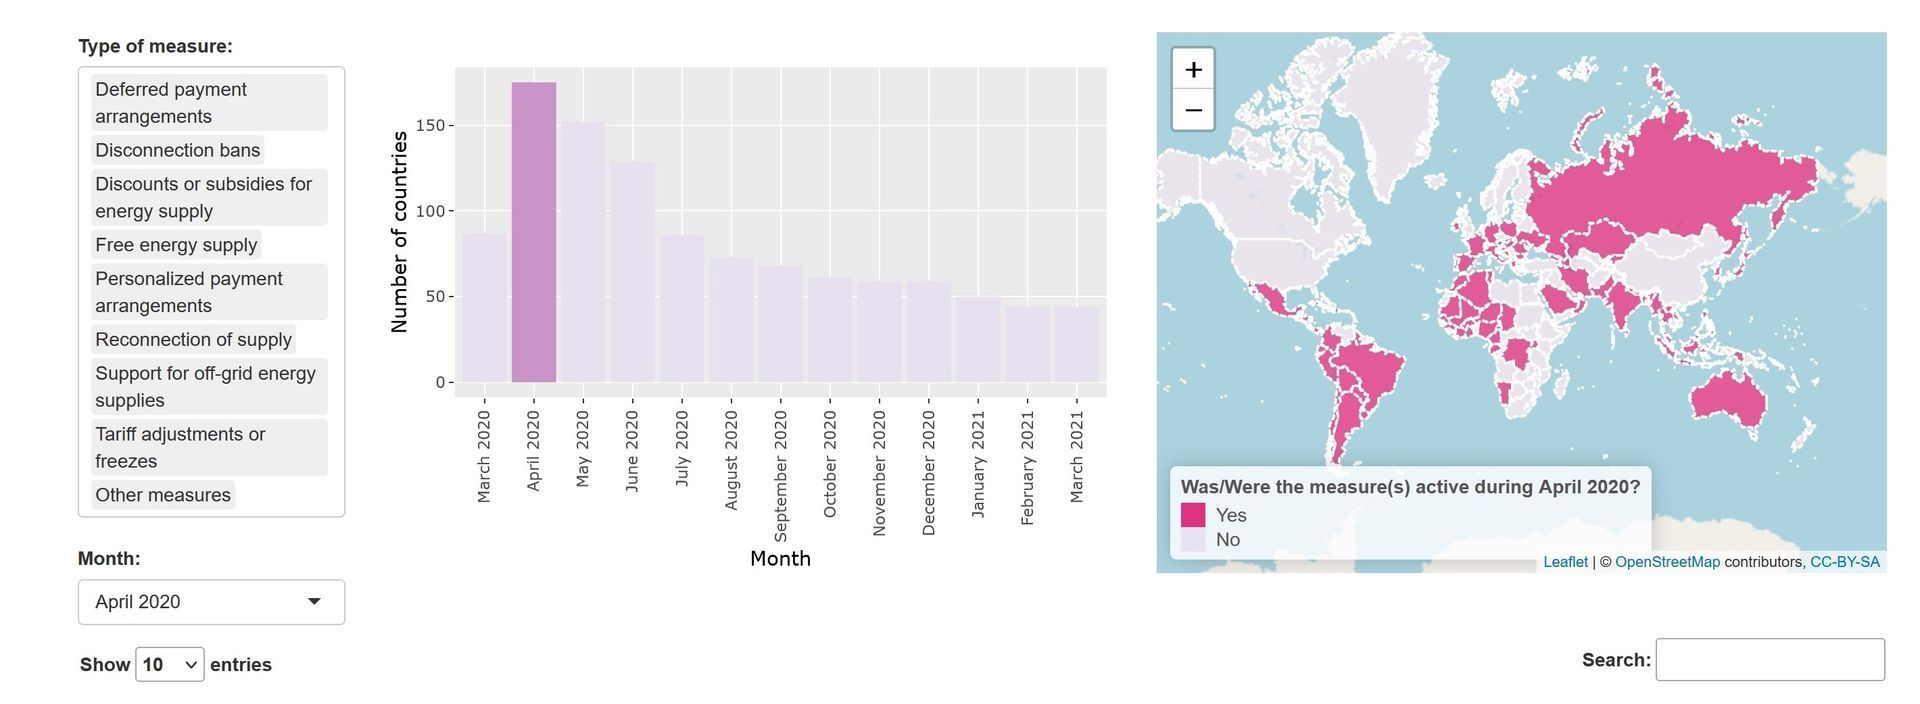
A reiteration of the original data set occured through the construction of a new panel dataset and Shiny Dashboard. The panel data set presents the original data in a novel longitudinal manner by providing a month-by-month overview of measures around the globe during the first year of the pandemic, from March 2020 to March 2021. To create it, the rich qualitative policy data on the COVID Energy Map was complemented by specific start and end-months of measures during this period, and as such, the dashboard operates alongside the original map. The new panel dataset and dashboard allow for a better understanding and visualisation of the development of measures over time. They were created by Juan Armando Torres Munguía et al., with funding from ENLIGHT/DAAD, and can be downloaded for further research. Publication. The methodology for the panel data-set, to be cited in addition to the original methodology, was published as Torres Munguía, Hesselman, Martínez-Zarzoso , Ruyssen (2025) https://doi.org/10.1080/15140326.2025.2483403.
Supported by:
Acknowledgments.
The COVID-19 Energy Map project is led by Marlies Hesselman, Anaïs Varo, Rachel Guyet and Harriet Thomson since March 2020, and was developed during the pandemic through research cooperation under the EU COST Action CA16232
European Energy Poverty (ENGAGER). The map benefitted from inputs and clarifications sought from partners in international networks, including particularly ENGAGER, as well as research assistants, especially from the University of Groningen and Sciences Po and Centre International de Formation Européenne (CIFE). In 2022, Juan Armando Torres Munguía created the new panel dataset and dashboard supported by funding from ENLIGHT/DAAD. Major updates on the Google Map platform for the period beyond March 2022 have been provided by Grace Nishikawa with support by Marlies Hesselman for regions with longer-term measures, notably in Asia and Europe until March 2022, and in Latin-America until September 2022. Special thanks goes to: Karla Ricalde, David Garcia Torres, José Grabiel Luis Cordova, Karla Cedano Villavicencio, Yanelys Delgado Triana, Asja Rusan, Trim Doli, Srgjan Vidoeski, Nadiya Nair, Mikeal Mengistu, Bagus Alif Widhiwipati, Youmna Hassanein, Tayma Tayfour, Antonia Holzmann, Stephanie Marinova, Alexia-Maria Giakkoupi, Marina Elena Heraclides, Shrey Shrestha, Reet Varma, Radu Cornea, Ada Butnaru, Nguyen Hanh Ha Nguyen, Rolanda Yung-Hoi, Laylan Kurdi, Tomáš Zicho, Jaanika Vainula, Anne Costova, Andrea Rodrigues, Isabella Hoogenhout, Beatrix Szatmari, Harriet Chinneide, Natasha Harte, Muhammad Rafi Raihan Quzwain, Slav Stankov Stankov, Deison Luigi Tuni, Federica Acquaviva, Inmaculada Martínez Zarzoso and Ilse Ruyssen.
